Two pictures can look almost identical and still differ at many pixels. A useful comparison begins with matching dimensions and a clear question: are you checking an edit, an export or a shifted composition?
- The tested example
- Step 1: Open Image Compare for corresponding-pixel review
- Step 2: Load the two controlled practice images
- Step 3: Move the wipe and leave pixel tolerance at zero
- Step 4: Compare pixels and read the orange difference map
- Check the result
- Troubleshooting
- Background and practical details
- Example sources
TESTED WORKED EXAMPLE
What this session produced
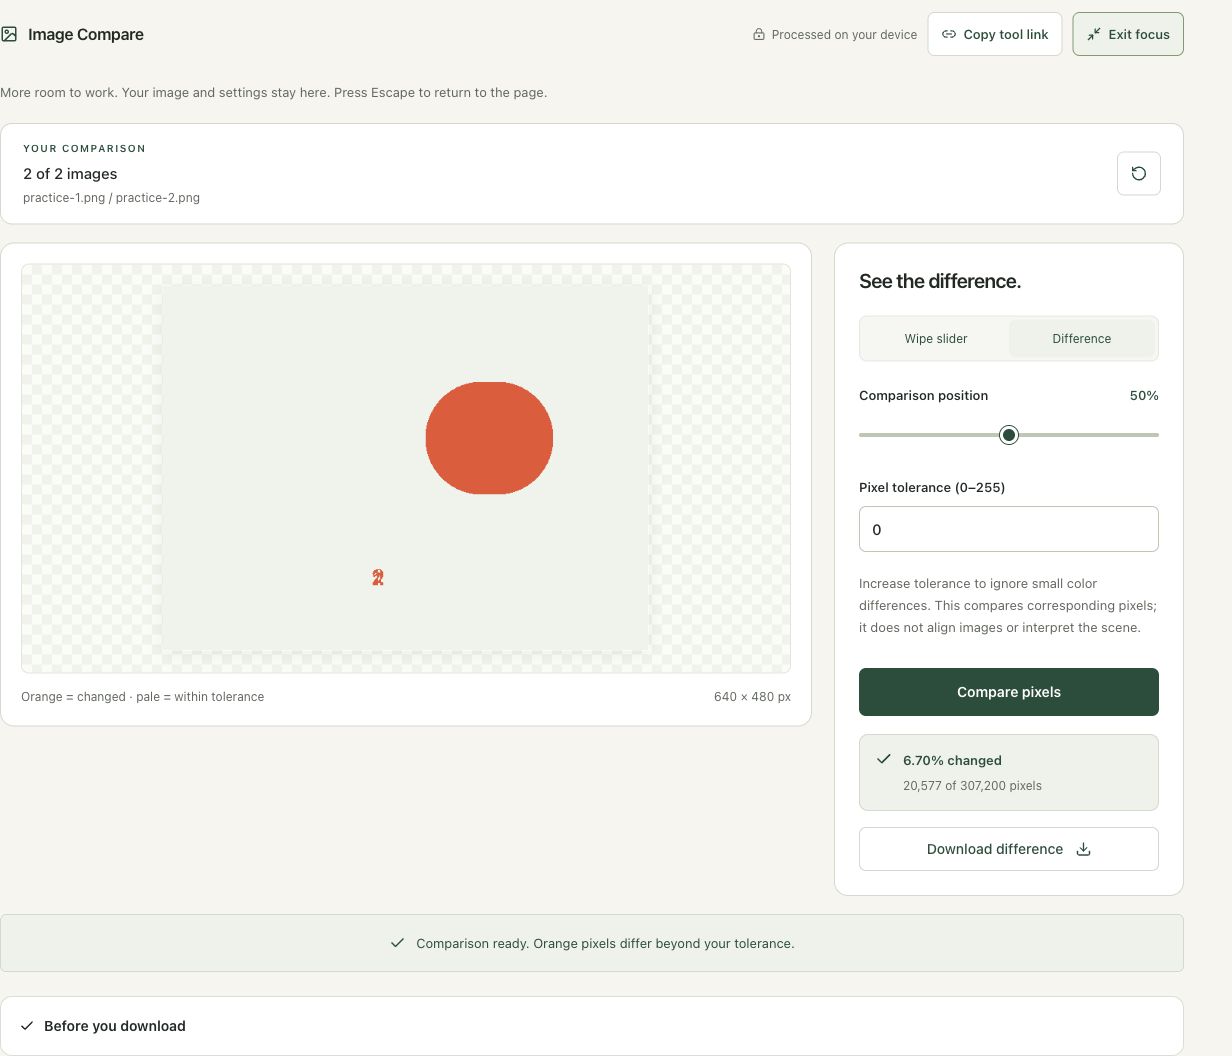
The two 640 × 480 synthetic images had 20,577 changed pixels out of 307,200 at tolerance zero, reported as 6.70%. The orange difference map marks changed corresponding pixels, not a semantic similarity score.
The screenshots were captured from our working tools on October 6, 2026. Focus workspace is used to give the controls and preview more room. Captures show either the full workspace or the relevant panel; they are not recreated interface illustrations. Sizes and outcomes describe this sample, not a promised result for every image.
Follow the worked example, step by step
Read the settings and the result together. Keep an untouched source when a file is edited, and check the finished output before using it in another application. Each numbered step below includes a real screenshot of the corresponding workspace state. Use the full-size link when a control label is too small on your screen.
Step 1: Open Image Compare for corresponding-pixel review
Open Image Compare. Choose images with matching dimensions and framing when you need a meaningful pixel comparison. This is useful for checking an export or an edit, but it does not align scenes automatically. Keep track of which image is the reference and which is the revised copy so the wipe preview remains easy to interpret.
Step 2: Load the two controlled practice images
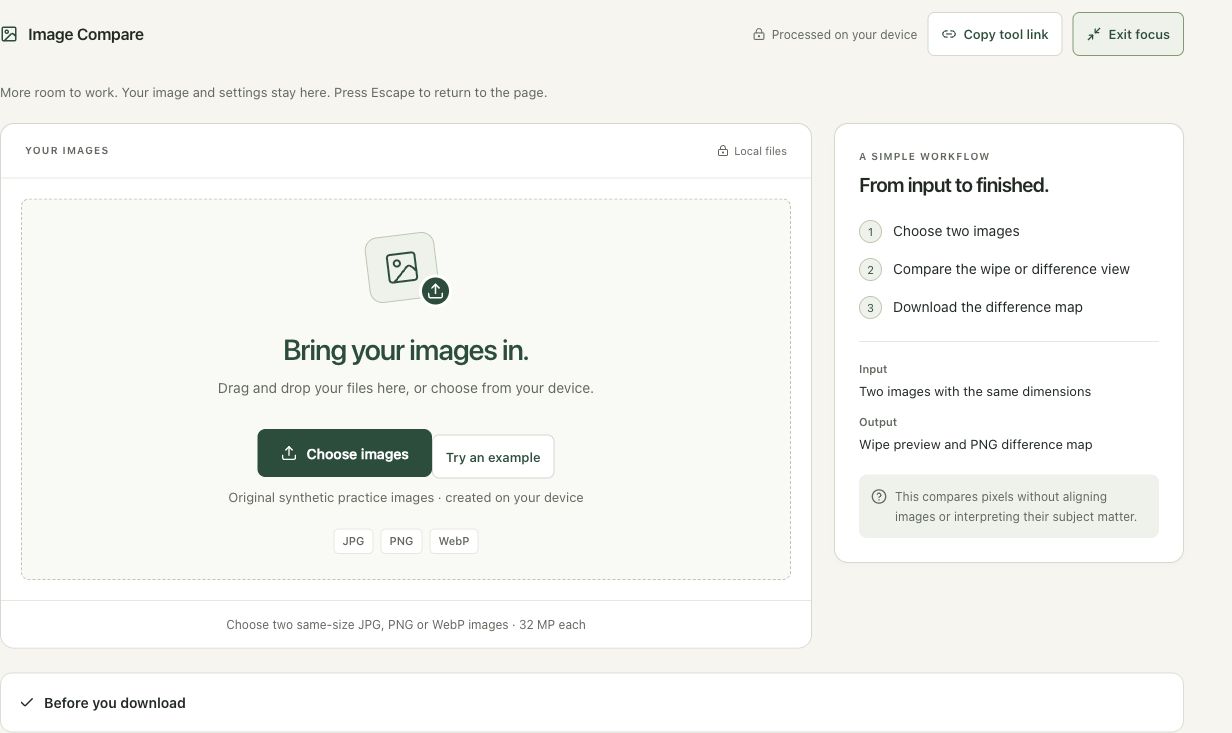
Use Try an example. Both graphics are 640 × 480, and the workspace identifies the first image on the left and the second on the right. Inspect the wipe preview before calculating a score. The practice pair contains deliberate changes, making it suitable for learning what the difference map measures without guessing whether a camera scene moved between shots.
Step 3: Move the wipe and leave pixel tolerance at zero
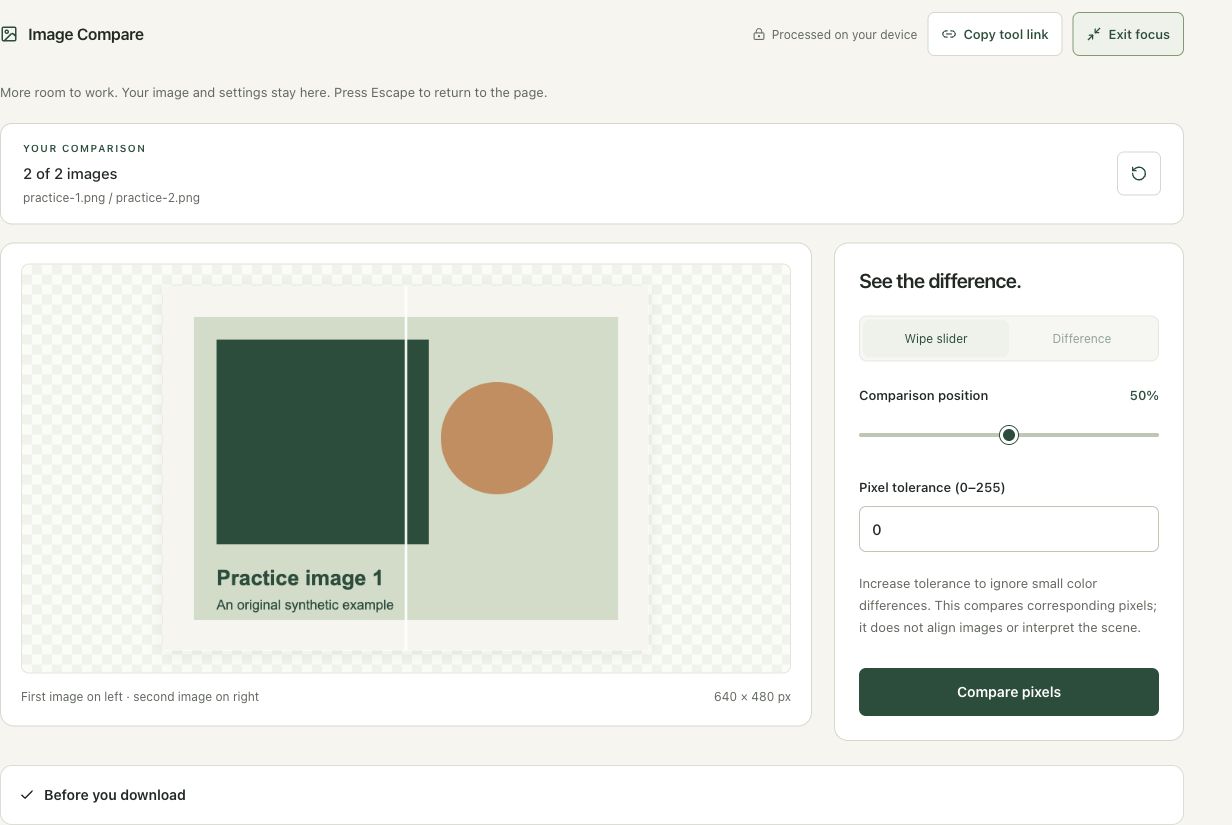
Move Comparison position to inspect different parts of the images; this screenshot shows 51%. Leave Pixel tolerance at 0 for an exact channel-difference comparison. Moving the divider changes only the preview, not the underlying files or the comparison threshold. Decide what differences matter before increasing tolerance, since a relaxed threshold intentionally ignores some changes.
Step 4: Compare pixels and read the orange difference map
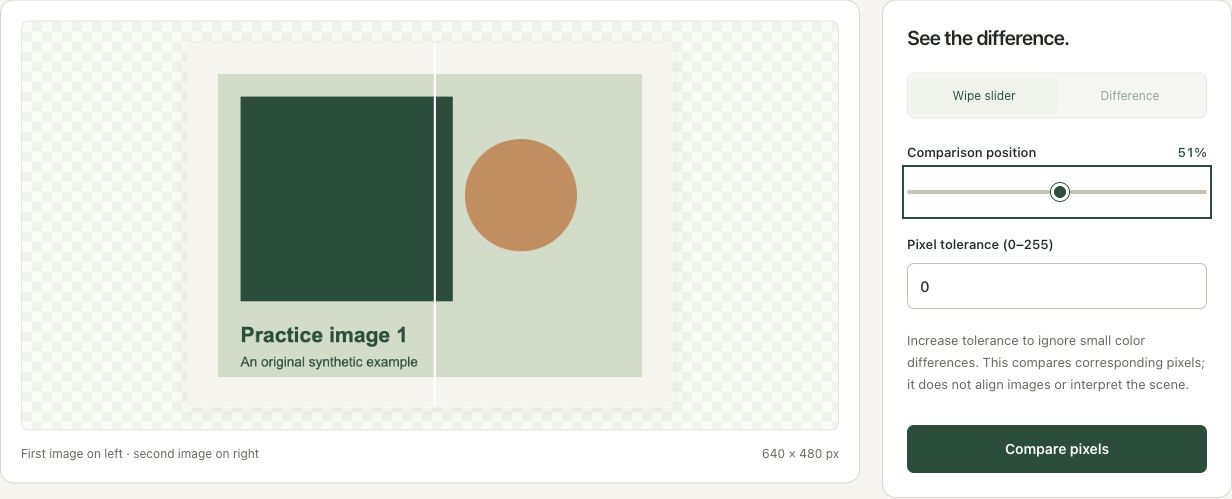
Choose Compare pixels, then Difference. The result reports 6.70% changed, or 20,577 pixels. Inspect where the orange pixels occur and relate them to the source graphics. Download the difference map if you need a record. Treat the number as a measurement of this aligned pair at the selected tolerance, not a rating of the edit’s usefulness or authenticity.
Check the result before using it
Confirm dimensions and alignment before interpreting the percentage. A one-pixel shift can create widespread differences even when the subject is the same. Check the map and original images together, and record the tolerance used.
If the result is not what you expected
This tool does not align photographs, judge image quality or identify people. Increase tolerance only when small channel differences are intentionally irrelevant, and compare results using the same threshold. A high unchanged percentage does not guarantee that a crucial small label is correct.
Background and practical details
Start with a meaningful pair
For an export comparison, use two versions made from the same original, at the same dimensions and with the same framing. For a local edit, use the original and the edited result. A different photograph of the same subject answers a different question: camera position, lighting and motion can all change the corresponding pixels.
Open Image Compare and choose two JPG, PNG or WebP files. Each must have the same width and height. The tool accepts images up to 50 MB, 8,192 pixels per side and 32 megapixels each. Animated inputs contribute a decoded still frame rather than a comparison of complete animations.
Check dimensions and alignment separately
Matching dimensions are necessary, but they do not prove matching alignment. A one-pixel shift can change many pixels along an edge. The workspace does not register images, correct camera perspective or automatically move one picture into alignment. Review the wipe preview before interpreting a percentage.
If dimensions differ, identify why before using Resize Image. A proportional resize can make the grid sizes match, but resampling itself changes pixels. Cropping one image to imitate the other can also change which source pixels occupy each location. For a fair encoding comparison, export both versions at the intended dimensions from the same source.
The fitted preview helps locate changes; it can conceal small artifacts because it displays fewer screen pixels than the source contains. The calculation itself uses the full image resolution. Inspect the actual files at a useful zoom when fine detail matters. Keep both source versions so the map can be understood later.
Understand what tolerance does
A tolerance of zero counts any difference in the comparison’s visible color or opacity. Increasing it ignores small differences. In the four-pixel example, one red channel changes by 4 and another by 20. At tolerance 0, two pixels count as changed: 50%. At tolerance 5, only the second counts: 25%. At tolerance 20, neither exceeds the threshold.
There is no single correct tolerance for every task. Use a low value to locate subtle encoding changes, then try a higher value to distinguish those from larger edits. Report the threshold with the result. A changed-pixel percentage without its tolerance and source context is easy to misinterpret.
Read transparency and the map correctly
The comparison evaluates visible color over white and also checks opacity. It ignores hidden RGB differences inside fully transparent pixels. Orange marks pixels beyond the tolerance; pale pixels are within it. The downloaded map is an illustration of locations, not a restored version of either input.
The MDN ImageData reference describes canvas pixel data in RGBA order. This workspace uses those decoded pixel values. It does not inspect every file byte, identify a subject or judge whether an edit improves the picture.
A percentage is not a quality rating
A small color adjustment can affect almost every pixel while leaving a useful image. A tiny but important changed digit can affect very few pixels. Judge the location and purpose of the change as well as its count. For byte-identical copies, use Duplicate Finder instead; two differently encoded files can decode to matching pixels without having matching bytes.
Keep your original files and check the actual download. If an instruction no longer matches the workspace, send us the page URL and a description. Our editorial policy explains how we document examples and limitations.
Example sources and screenshot notes
This example uses original synthetic practice graphics created by Smart Image Tools. They are controlled fixtures, not photographic performance benchmarks.
The controls shown are from the version tested for this guide. A later interface update or a different source can change a result. Compare the displayed format, dimensions and status with the instructions, and report a mismatch with the article URL and the setting involved. Our editorial policy explains how examples and corrections are reviewed.
Find the right tool for your image.
Explore the free workspaces, read their methods and inspect your result before sharing.
Explore image tools